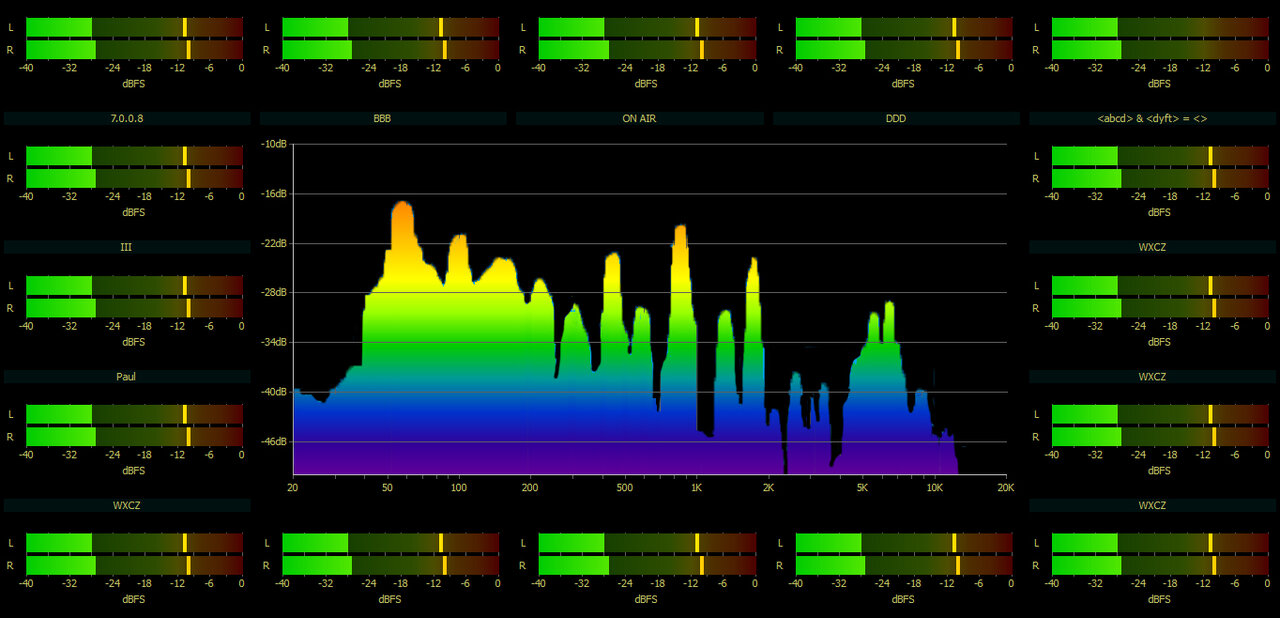
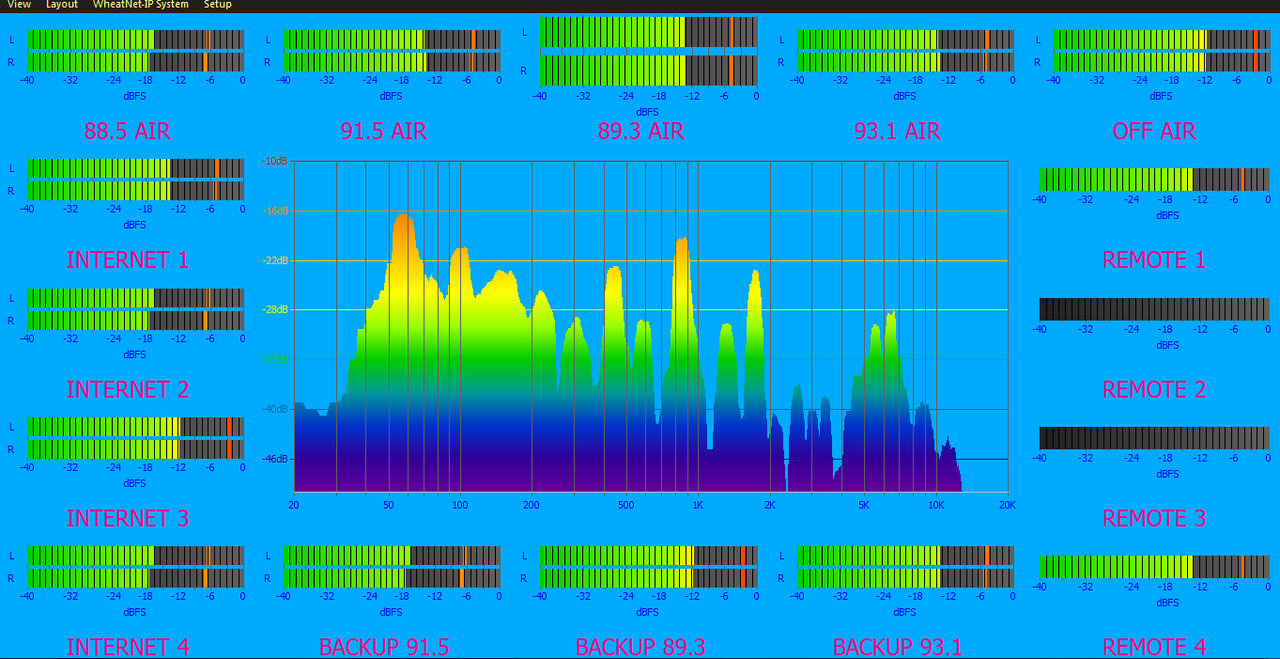
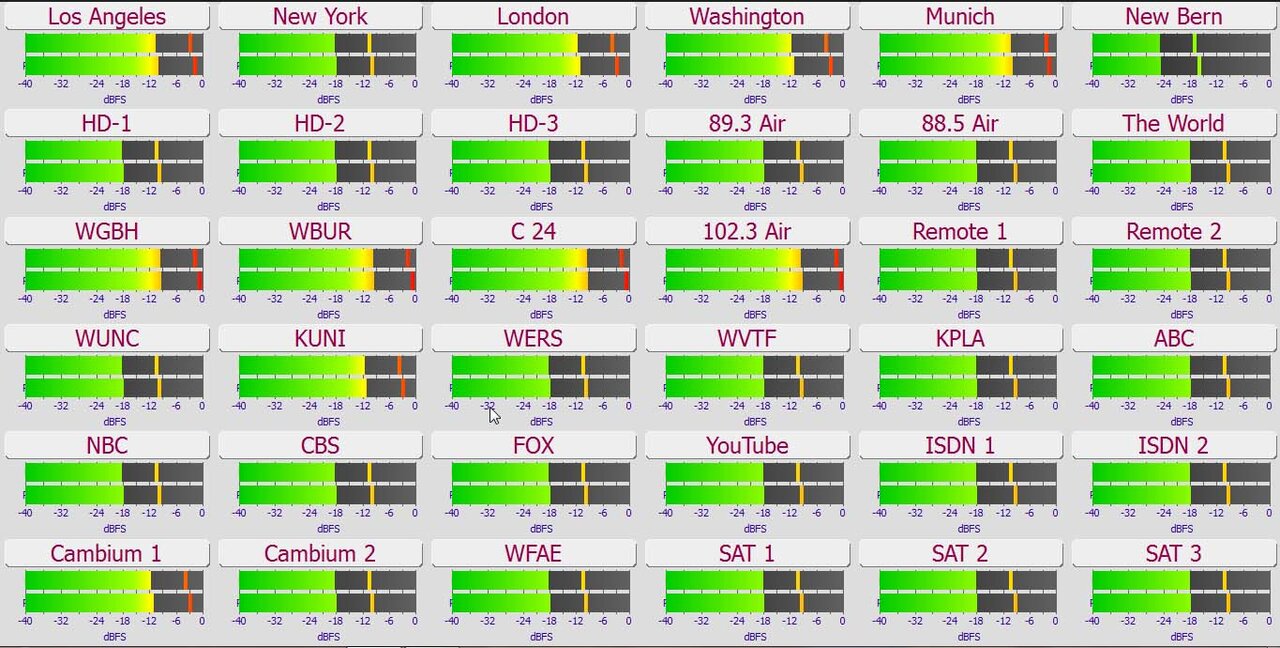
◾Multiple bargraph meters in one computer display for checking levels of any source, destination or audio path in a WheatNet-IP network
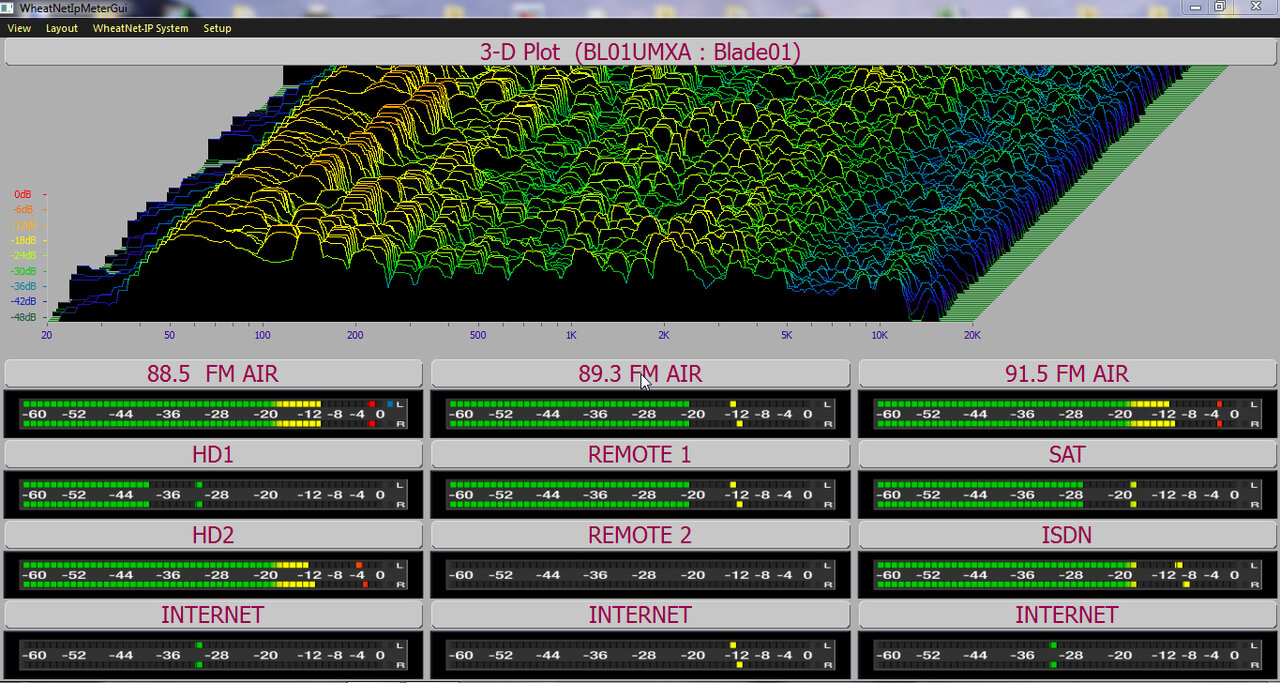
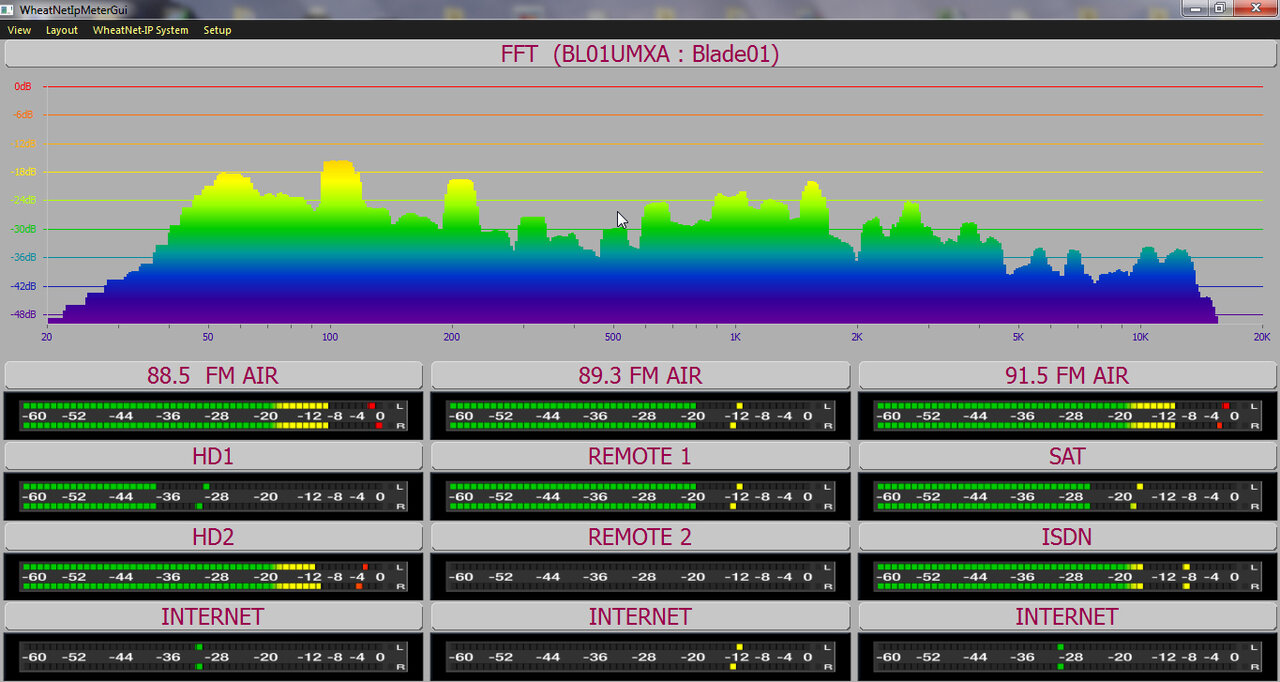
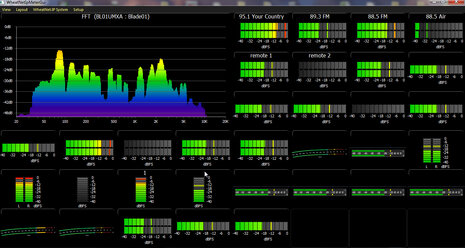
◾Separate analysis window for detailed signal evaluation using FFT, 3-D plot, oscilloscope, energy vs. frequency, spectral dynamic range, and other tools
◾Real-time metering of audio peak levels, average levels and peak over average levels ; stereo or mono
◾Two to more than 60 meter cells in a single display screen
◾Style of metering can be curved “eyebrow,” horizontal or vertical bargraph (you determine the number of bars)
◾Silence detection/failover at a glance for alerting you if an audio stream has failed
◾Customizable as an overall grid layout of meters with color options and font selections for metering in a way that makes sense to you
Produits
IP METERS GUI - WHEATSTONE
Get a quick read of any audio source, destination or stream in your WheatNet-IP Intelligent Network. Our new IP Meters GUI app displays a “wall of meters” on your computer screen for ongoing monitoring of audio peak levels and average levels at selected points throughout the entire network. Included is a separate FFT meter for spectral readings plus visual alerts should a channel go dark.
In today’s connected world of AoIP, it’s nice to know what’s going on with your audio. Not just the audio at local sources and destinations, either, but all audio at every point in your network. You could haul out all that expensive test gear for a look, but who has time for that ? It’s much easier to drop in an app like our new IP Meters GUI for the WheatNet-IP network, which gives you ongoing metering of audio levels, signal density, FFT readings — the works.
Fully customizable, the IP-MTR64 Meters GUI lets you display an almost limitless array of metering and analysis on the monitor of any computer connected to the WheatNet-IP Intelligent Network. Plus, meters have silence detection, so you can see at a glance if an audio stream has gone down, and where.
Each meter – or cell – in your IP “wall of meters” can be set up as a horizontal, vertical or eyebrow bargraph meter. You can set up two or 20 or 60 or more cells in one “wall.” You determine where and what to meter : console inputs, mic outputs, the satellite receiver, studios, web streams, you name it. In addition, a separate analysis window allows you to view one audio stream in a variety of informative ways, including FFT, 3-D plot, oscilloscope, energy vs. frequency, spectral dynamic range, and more.
Meters are arranged in a grid layout with the number of individual cells and the size and location of analysis windows you want. Style of metering can be curved, horizontal or vertical bargraph (you determine the number of bars) for mono or stereo, and for reading peak levels, average levels and peak over average levels. Set up one or two bright VU or PPM meters for instant loudness verification of on-air studios from across the room, for example, and add five or 10 or 30 side meters for checking levels of players and mics feeding those studios. Size, background color and text labeling for each cell is fully customizable by you. One meter at a time can be zoomed to a full-screen view for detailed observation. Multiple layouts, complete with source selection, metering choices, colors, labels, and analysis settings, can be saved and recalled for use in various situations.
Plus de photos...